
Track GitHub star growth and embed the chart in your README
In short:
curl 'https://freetools.one/v1/stars?github=torvalds/linux' returns the cumulative
star count over time, and /v1/stars/chart?github=torvalds/linux returns a
ready-made SVG image you can put in a README with one line of Markdown.
Stars are the closest thing GitHub has to a popularity metric, but a star count on its own is a snapshot. What you usually want to know is how fast it is growing, when it spiked, and whether that spike is still going. That needs a series, and building one from the stargazer list is harder than it looks — GitHub restricts that endpoint.
Getting the data
curl 'https://freetools.one/v1/stars?github=torvalds/linux'You get a flat array of {"x": "2011-09-04", "y": 0} points, where
y is the running total. The last point always matches the repository's current star
count.
const h = await (await fetch('https://freetools.one/v1/stars?github=cli/cli')).json();
console.log(h.at(-1));   // { x: '2026-09-25', y: 54912 }
Embedding the chart in a README
This is the part that pays off, because the image stays current without you doing anything:
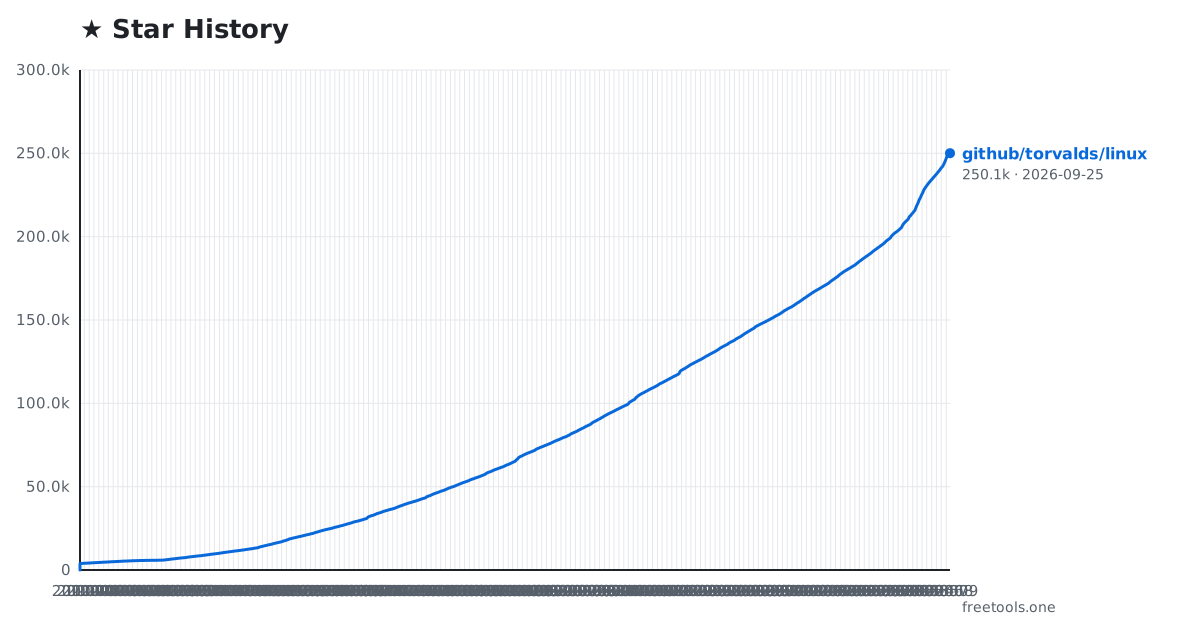The endpoint returns SVG at 1200×630, which is exactly the aspect ratio GitHub renders well.
Add &theme=dark for a dark variant.
Comparing several repositories
Repeat the parameter to overlay up to six repositories, from GitHub and GitLab mixed:
Each series gets its own colour, and the interactive version on the star history tool adds totals, 7/30-day growth per repository, log scale, PNG and CSV export.
How the data is obtained
GitHub restricts the stargazer listing to repository admins and collaborators, and since July 2026 it requires authentication. FreeTools uses GitHub's official weekly star-history endpoint instead and anchors the series to the live total, so the final point is always accurate. GitLab publishes per-day history, so those series are daily.
Monitoring growth in CI
python3 - <<'PY'
import json, urllib.request
h = json.load(urllib.request.urlopen(
    'https://freetools.one/v1/stars?github=torvalds/linux'))
print('stars now:', h[-1]['y'])
PY
Caching and limits
Star history moves slowly, so results are cached for six hours and refreshed in the background. Repeat calls return in about 50 ms and the limit is 30 requests per minute per IP address.
What the shape of the data tells you
Because the series is cumulative and never decreases, the slope between two points is the growth rate for that period. A steep segment means a spike — a launch, a blog post, a conference talk. Long flat sections mean a repository that found its audience and then settled.
This is why the chart is more useful than the number: "12,000 stars" says nothing, while "grew 4,000 in the six weeks after a Hacker News post" is actionable.
Downloading the CSV
If you want to chart the series somewhere else, the interactive tool exports CSV directly. The JSON endpoint is the source if you would rather pull it yourself:
curl -s 'https://freetools.one/v1/stars?github=cli/cli' \
  | jq -r '.[] | "\(.x),\(.y)"' > cli-stars.csv
Comparing growth rather than totals
Totals are unfair between projects of different ages. To compare momentum, measure the change over a fixed recent window instead:
import requests, datetime

def growth(repo, days=90):
    h = requests.get('https://freetools.one/v1/stars',
                     params={'github': repo}).json()
    now = h[-1]['y']
    cutoff = (datetime.date.fromisoformat(h[-1]['x'])
              - datetime.timedelta(days=days)).isoformat()
    then = next((p['y'] for p in h if p['x'] >= cutoff), 0)
    return now - then

for r in ('cli/cli', 'BurntSushi/ripgrep', 'sharkdp/bat'):
    print(f"{r:24} +{{growth(r)}} stars in 90 days")
Embedding options compared
| Approach | Updates itself | Best for |
|---|---|---|
| SVG endpoint in Markdown | Yes | READMEs — the usual choice |
| Interactive tool | Yes | Comparing several repositories, exporting PNG/CSV |
| JSON endpoint | Yes | Your own charts, alerts and analysis |
| Downloaded PNG | No | Slides and documents |
Rate limits and caching
History is requested from GitHub and cached for six hours with a background refresh, so the
limit of 30 requests per minute is not a practical constraint. Each response reports
X-Cache: HIT, STALE or MISS, and cached responses return
in roughly 50 ms.
Using the same chart in your own tooling
The SVG is a plain XML document, so you can post-process it — recolour the lines, change the
title or drop the watermark — before committing it to a repository. Request
theme=dark if your README uses a dark background.
Frequently asked questions
How do I get a GitHub star history chart for my repository?
Use the SVG endpoint in a Markdown image tag: . It returns a 1200x630 image that updates automatically as your stars grow.
Why is the GitHub star history weekly rather than daily?
GitHub restricts its stargazer listing to admins and collaborators and requires authentication since July 2026. FreeTools uses GitHub's official weekly history endpoint and anchors the series to the live star total, so the last point is exact.
Can I compare star growth across several repositories?
Yes. Repeat the github or gitlab parameter up to six times on both /v1/stars and /v1/stars/chart. GitHub and GitLab repositories can be mixed in the same chart.
Does the star history API need a key?
No. It is a plain GET endpoint with no authentication. Results are cached for six hours, so repeated calls are fast and the 30 requests per minute limit is rarely reached.